Data points to video
- Status: Closed
- Premie: $100
- Mottatte bidrag: 4
- Vinner: ZhanBay
Konkurransesammendrag
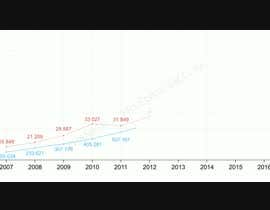
I want to show 11 years worth of data (two data points) over time in a video. Ideally it would be two lines moving over time that would be dispersed throughout the video. If that's not possible just to show the two data points going up over the years 2007 through 2018.
Year Total Number Served Lbs of Food distributed
2007 16849 150034
2008 21209 233627
2009 25587 307176
2010 33027 405281
2011 31849 537167
2012 38749 685246
2013 37096 863390
2014 37470 1084442
2015 80260 1336798
2016 76345 1770829
2017 92276 2120798
2018 77460 1809000
Anbefalte ferdigheter
Arbeidsgivers tilbakemelding
“Very skilled but needs to work on English proficiency.”
![]() missioned, United States.
missioned, United States.
Beste bidrag i denne konkurransen
-
ZhanBay Kazakhstan
-
imnajungshinkdir India
-
thanghm Vietnam
-
steam3d Russian Federation
Offentlig avklaringstavle
Hvordan å komme i gang med konkurranser
-

Legg ut din konkurranse Raskt og enkelt
-

Få mange bidrag Fra hele verden
-

Kår det beste bidraget Last ned filene - Enkelt!


