denysmuzia
Ukraine

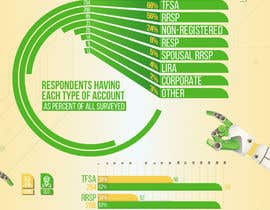
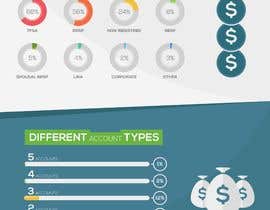
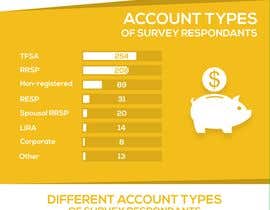
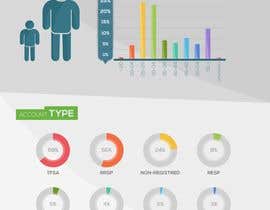
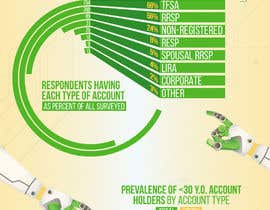
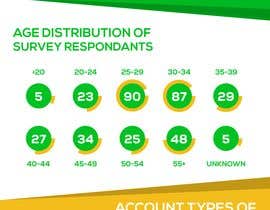
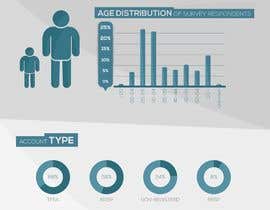
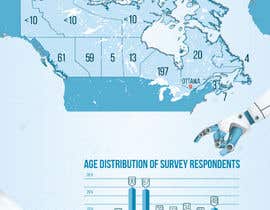
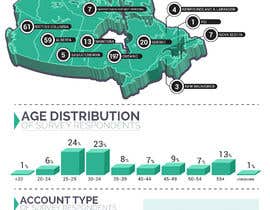
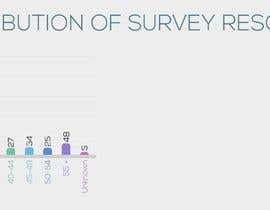
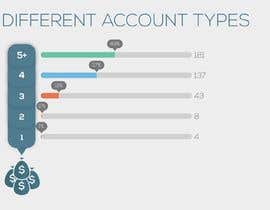
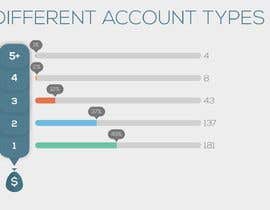
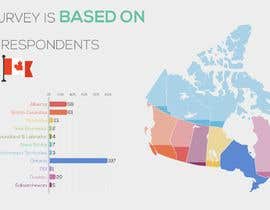
We have conducted a survey of Canadian users of Robo-advisors. We need to create the infographics based on the survey results. The attached file has the first 6 summaries of those results.
Our total budget is $300, of which $150 will be awarded to the winner of this contest. Additionally, the winner will be offered to create the remaining 6 graphs for the price of $150.
Graphs from the attached file are standard simple excel graphs. You may want to use a different visualization idea for some of them if you feel necessary. The main goal is to create a good presentation of the results.
The survey was done by YoungAndThrifty. Please see their site https://youngandthrifty.ca/ for colors, styles, logo etc
We are also limited in time. I expect to select the winner within 48 hours and then complete the task within the next 48 hours.
“Denys is an excellent designer and a very diligent and understanding worker. Highly recommended.”
![]() Umnikey, United States.
Umnikey, United States.


Legg ut din konkurranse Raskt og enkelt

Få mange bidrag Fra hele verden

Kår det beste bidraget Last ned filene - Enkelt!