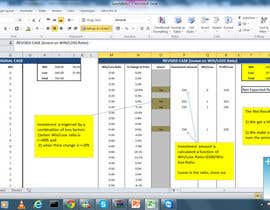
Automated Data/Statistical/Stock Analysis/Sports Betting

  • Status: Closed
  • Premie: $490
  • Mottatte bidrag: 17
  • Vinner: vivekgarg96

Konkurransesammendrag

UPDATED BRIEF:

Folks, thank you for the responses so far. I have something very specific in mind and I used the stock analogy to help explain my scenario. I want to be able to enter a range of values into an Excel sheet as provided originally.

The values actually relate to sports odds and I want the ability to easily perform data manipulation. Some of these requirements would be to delete all rows where the values fall outside a specific range (e.g. between 2.50 to 3.00) and have the remaining rows plotted on a graph with the usual support and resistance lines, moving averages, etc.

I already know the statistical percentage of winning bets but want this to be configurable. So if I said that 50% of bets are successful you could further improve my chances of winning by devising some further indicators on the graph to tell me when to place a bet. Please take the bet price into consideration if you feel that this should be used to determine a variable staking plan.

Please see latest sample attached which shows those bets that were successful (column A) and the relevant odds which were between 1.8 and 2.2 (column B). There are 761 bets with 368 of them winning. That's an average strike rate of 48% with an average price of 2.00.

It's unlikely that anyone will be able to produce exactly what I'm looking for but I'll probably engage with somebody based on the responses received and provide more details and take it from there until we get close to what I'm looking for.

ORIGINAL BRIEF:

Taking the attached master spreadsheet can you plot a graph based on the running share price in column A. This includes the daily closing trading price of a specific stock from Monday to Friday for one complete year.

Please apply some support and resistance lines to the graph to see where would be most beneficial regarding trading the stock (i.e. where to buy and sell)?

Using your statistical expertise can you also recommend other methods of profiting from this trading range? For example, what win loss ratios and stop losses, etc. would best suit. Please also include any other analysis/formulas/scenarios that would help identify a profitable return.

Ideally, I would like to have your thought analysis saved as a blueprint so that I can take it and apply it to any scenario. I understand that each scenario is different but if you can devise something that would be worth applying to the majority of situations. In other words, I want some formula/macro/program that can be run against a spreadsheet that will plot support and resistance lines against a running stock price and provide best fit win/loss ratios, etc.

I also want the ability to remove certain periods from the master spreadsheet. For example if I decided to remove every 5th row from the spreadsheet, the support/resistance lines would recalculate based on the new data. I say every 5th row so that data for one day of the week (i.e. Friday in this instance) is excluded. It might be best to use two further worksheets to show the separation of data (i.e. one showing all Friday data and one showing all Monday to Thursday data). The idea behind this is that I’d like see if I could profit from trading based on one day only so the newly created formulas/macros/programs could be applied to a smaller set of data.

Taking it another step, if I was looking to trade on a Friday, could you combine the original master graph and the new Friday graph to signal stronger buy/sell indicators?

To go one final step, I want to extract a collection of rows and graph them separately like we did with the Friday data. The rows and the amount of them would be random so I would want the ability to remove, for example, rows 11, 56, 174, 375, 5752, and 6855. This idea behind this is that I want to plot a graph of the stock price every time there is a news announcement.

I would also like this graph to be combined with the master graph to help identify stronger buy/sell signals.

Anbefalte ferdigheter

Offentlig avklaringstavle

  • Collie33
    Konkurranseholder
    • 10 år siden

    Folks,

    Thank you very much for your precious time in submitting your entries. I have reviewed them all and I believe I have chosen a winning entry. I'll make contact with the owner and provided they can meet certain conditions I'll award them the prize. If they can't I may extend the contest in the coming days.

    I was also impressed with one or two close runners up and I'll be keeping them in mind and I may call upon them if I need to fine tune my current idea or if I have any possible future projects/contests of a similar nature. It would be great if I could work with a few people but right now I just want to concentrate on working solely with one freelancer due to my time restrictions.

    Regards,
    Collie

    • 10 år siden
  • NitinGK
    NitinGK
    • 10 år siden

    Could you please extend this?

    • 10 år siden
  • Collie33
    Konkurranseholder
    • 10 år siden

    Folks, I'm going offline now but will either choose a winner or extend the deadline tomorrow after the contest has closed. I'm still undecided as to who to pick but I have a shortlist of 3 at this point. Any new entries will be taken into consideration before a final decision is made.

    • 10 år siden
    1. Pendosa
      Pendosa
      • 10 år siden

      I had an interesting answer, please contact me.

      • 10 år siden
  • Pendosa
    Pendosa
    • 10 år siden

    I had an interesting answer, please contact me.

    • 10 år siden
  • kukrety
    kukrety
    • 10 år siden

    In the light of updated brief, please consider increasing the deadline to a reasonable date, maybe 3 days.

    • 10 år siden
  • Collie33
    Konkurranseholder
    • 10 år siden

    There is less than a day remaining on this contest but I might be tempted to extend the duration if I think the responses warrant it.

    • 10 år siden
    1. Attila93
      Attila93
      • 10 år siden

      Amazing contest. Last week I had the same idea as you did. I've been betting for 6 years and I believe I'm no longer a newbie. Please Pm me to discuss your idea, inside or outside the contest because I believe we can solve our problems very easily. I have an idea about how to make this work and how to find an algorythm of winning. Maybe these people can do better work than me in excel, but I bet they have no idea about sports betting. Give me half an hour of your time and it won't be a waste

      • 10 år siden
    2. Collie33
      Konkurranseholder
      • 10 år siden

      Hi, I don't want to give my complete idea away but I'm happy to discuss past experiences and any other ideas. I'd also be willing to provide future opportunities based on a solution to those who are interested.

      • 10 år siden
  • SteveP495
    SteveP495
    • 10 år siden

    Hi,
    Either you have something very specific in mind or you're not exactly sure of what you want IMHO. I've traded and built systems for years (including Insto Stuff). Really sounds like you need some light charting backed up by a database to make days and dates specifications easier and more robust than just Excel alone.

    • 10 år siden
    1. Collie33
      Konkurranseholder
      • 10 år siden

      Yes, I have something very specific in mind and I used the stock analogy to help explain my scenario. I'll be providing further details...

      • 10 år siden
  • vivekgarg96
    vivekgarg96
    • 10 år siden

    Hi,
    I have added a momentum based analysis framework in my submission (Entry # 8) - C-RSI - Relative strength index. In general you should buy when this index is above 50 and is increasing. You should sell if it is below 35 and is decreasing. Similarly their could be many more such general framework that can be created and applied to any given stock. I need your view on using C-RSI. Thanks

    • 10 år siden
  • kelinciku
    kelinciku
    • 10 år siden

    Dear contest holder,
    would you mind to give an example of what you need, because in the spreadsheet, I only find numbers and no description for which transaction they belong to.

    Regards

    • 10 år siden
    1. Collie33
      Konkurranseholder
      • 10 år siden

      The data is not real so feel free to pick any stock ticker and use the prices for that. I want to be able to apply some formula to any stock price over a period of time. By formula, I need something that will at a basic level identify good support and resistance lines automatically. The formula should be generic enough so that it can be applied to any set of figures.

      • 10 år siden
    2. vivekgarg96
      vivekgarg96
      • 10 år siden

      I have added a momentum based analysis framework in my submission (Entry # 8) - C-RSI - Relative strength index. In general you should buy when this index is above 50 and is increasing. You should sell if it is below 35 and is decreasing. Similarly their could be many more such general framework that can be created and applied to any given stock. I need your view on using C-RSI. Thanks

      • 10 år siden
  • sourabhjain81
    sourabhjain81
    • 10 år siden

    Hi,
    There are more than 7000 prices, for one year they should by only 250 or so. Why so much data? Also, why many of the prices are negavtive?

    • 10 år siden
    1. Collie33
      Konkurranseholder
      • 10 år siden

      The data is not real so feel free to pick any stock ticker and use the prices for that. If you wish, you could take the lowest figure and make that zero and increment the other figures appropriately.

      • 10 år siden

Vis flere kommentarer

Hvordan å komme i gang med konkurranser

  • Legg ut din konkurransen

    Legg ut din konkurranse Raskt og enkelt

  • Få mange bidrag

    Få mange bidrag Fra hele verden

  • Kår det beste bidraget

    Kår det beste bidraget Last ned filene - Enkelt!

Legg ut en konkurranse nå eller bli med i dag!